Case studyLive
Pulse
Status pages with real SLOs: uptime checks from three regions, a DOWN only when a quorum agrees, and error budgets with multi-window burn-rate alerts.
- Role
- Solo — product, design implementation, backend, infra
- When
- 2026
- Backend
- DevOps
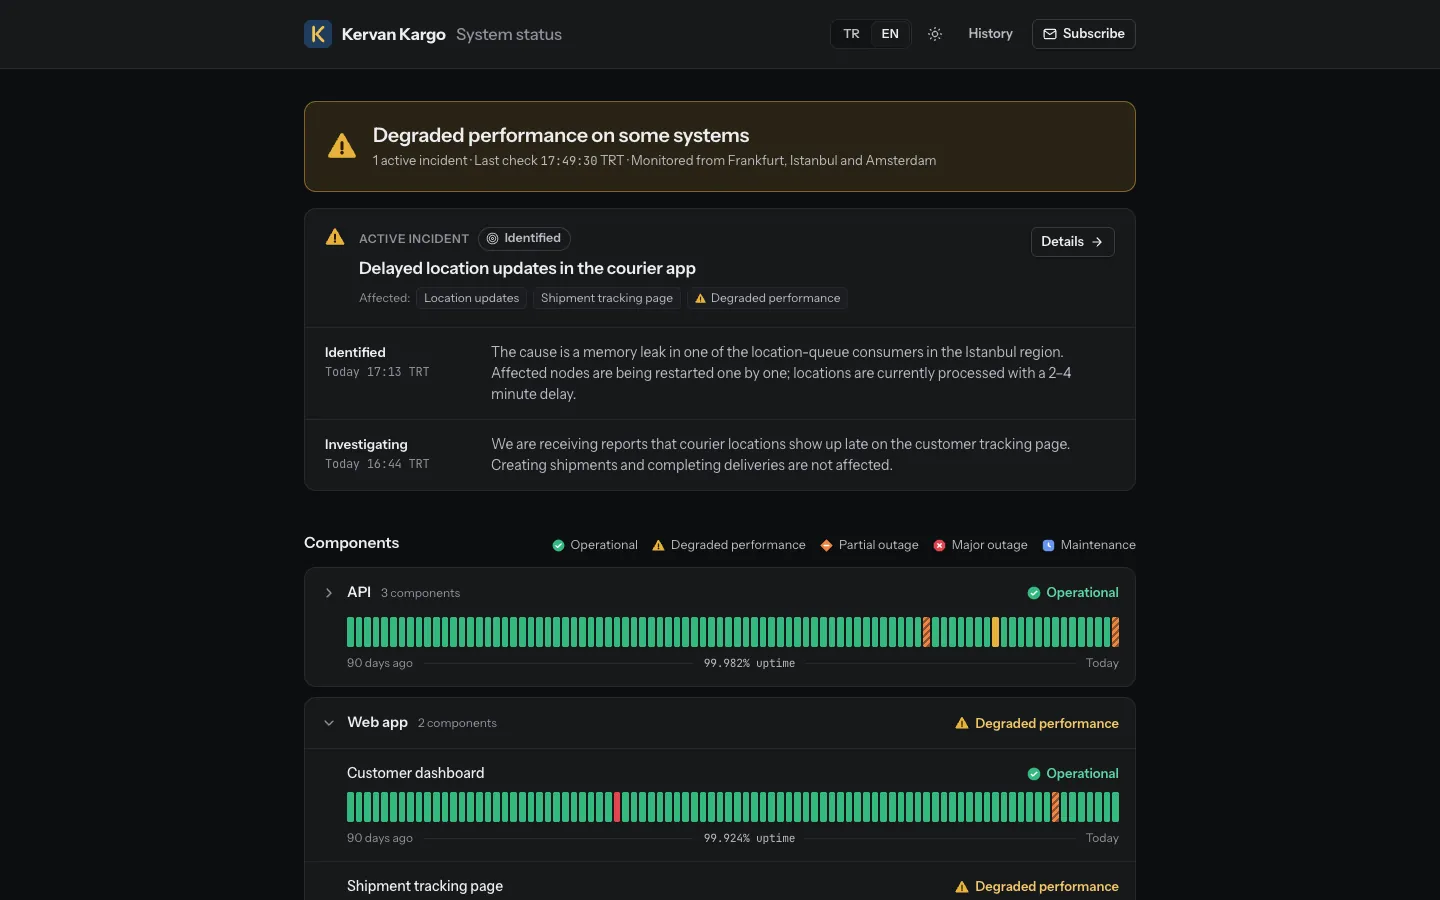
Open the live demo, no sign-up: a read-only dashboard for Kervan Kargo, a fictional logistics company with 90 days of history and live synthetic probes. The source is private.
Who it’s for
- Small teams and solo builders who ship to customers and need two things a plain uptime pinger doesn’t give: no 3 a.m. page for a regional network blip, and an honest error budget instead of a vanity uptime number.
- Their customers, who read a public status page that matches what was actually measured — Turkish and English, times in Europe/Istanbul.
- Me, first: Pulse monitors melihkizmaz.dev, naylalabs.com, meetmentorz.com and the APIs of my other products.
What I built
- Built it alone as one Worker on Cloudflare’s free plan: the React app as static assets, a Hono API, a Coordinator Durable Object whose alarm ticks every 30 s, three Probe Durable Objects placed with locationHint for Frankfurt, Istanbul and Amsterdam (each records its real colo), D1 and KV.
- A pure, tested core — quorum, the monitor state machine with hysteresis and flap suppression, burn-rate math, mergeable latency histograms and rollups — used verbatim by the Durable Object and by the proof harness.
- The product: HTTP(S) and heartbeat monitors at 30 s, 1 min or 5 min, SLOs with error budgets and burn-rate alerts, incidents that open and resolve themselves (with manual updates), public status pages with a JSON API, SVG badge and embed widget, and alerts to Slack, Telegram, signed webhooks or email.
- A public, read-only demo — Kervan Kargo, a fictional logistics company with 90 days of history and live synthetic probes through the same pipeline — plus API keys with an idempotent monitor API, a chaos target with dialable failures, and the simulation and local end-to-end runs behind every claim.
How it works
1Register a monitor
In the dashboard, or from code with an API key — idempotent by your own reference. HTTP(S) with method, expected status, keyword and latency threshold, or a heartbeat URL for cron jobs; an interval and an SLO target.
2Probe from three regions
Every 30 s the Coordinator fans the due checks out to the probes in Frankfurt, Istanbul and Amsterdam.
3Decide by quorum
A round is DOWN only when at least 2 of 3 regions fail. The monitor goes DOWN after 2 DOWN rounds in a row and recovers after 2 good ones; flapping is detected and silenced.
4Roll up and budget
Rounds roll up to minutes, hours and days with p50/p95/p99 per region. The error budget burns down; a page fires when the 1-hour and 5-minute windows both burn at ≥ 14.4×, a ticket when 6 hours and 30 minutes both burn at ≥ 6×.
5Tell people
The incident opens and resolves itself (Investigating → Identified → Monitoring → Resolved), the status page, JSON API and badge update, and the alert goes to Slack, Telegram, a signed webhook or email.
Key decisions
01
Quorum and hysteresis, not a single pinger
Instead of: Alert when one location fails twice in a row.
Why: A blip in one region isn’t an outage. A round counts as DOWN only when at least 2 of 3 regions fail, and the monitor needs 2 such rounds in a row. In 30 simulated days with 20% single-region failures that gave 0 false incidents; the same noise seen from one location raised 2,786 false alerts.
02
Never write raw checks to D1
Instead of: One database row per check.
Why: One row per check would burn the free plan’s 100,000 writes a day with three monitors. Rounds live in the Coordinator’s SQLite storage; D1 gets one minute rollup per monitor with a log-bucket histogram per region, so hour and day rollups merge exactly and percentiles stay within about 10% at every level. The trade-off: the per-check log only goes back 40 rounds.
03
One pure core for production and the proofs
Instead of: Test the scheduler against a model of itself.
Why: Quorum, the state machine, burn-rate math and rollups are pure functions, used verbatim by the Durable Object and by the simulation harness — so the proofs exercise production code, not a copy. Burn-rate alerts fired exactly when the SRE workbook says they should, to the minute, in 6 of 6 scenarios.
04
One Worker, Durable Object alarms for 30-second checks
Instead of: Cloudflare Pages for the app and a separate Worker for cron.
Why: Cron’s minimum is one minute; a Durable Object alarm gives 30 s. Pages would still need a separate Worker for the cron and the Durable Object classes — two deploys and cross-script bindings. The quota analysis: the 14 default monitors use at most 45% of any daily free-plan quota, and the plan holds about 35.
Architecture
One Worker deploy ships the app, the API, the scheduler and the probes; raw checks stay in the Coordinator, D1 only sees minute rollups. Everything here is mine.
Numbers
- outage → incident and alert on the local stack (60 s interval)
- 60.4 s
- false DOWN incidents in 30 simulated days of 20% single-region failures — 2,786 without quorum
- 0
- burn-rate scenarios that fire when the SRE workbook says, to the minute
- 6 / 6
- a month — Cloudflare’s free plan
- €0
Tech stack
Backend
- Cloudflare Workers
- Durable Objects
- D1 (SQLite)
- Workers KV
- Hono
- TypeScript
- Cron Triggers
- PBKDF2
Frontend
- React
- React Router
- Vite
Reliability
- Quorum + hysteresis
- Multi-window burn-rate alerts
- Log-bucket histograms
- HMAC-signed webhooks
Quality
- Vitest
- Simulation harness
- wrangler dry-run
Gallery
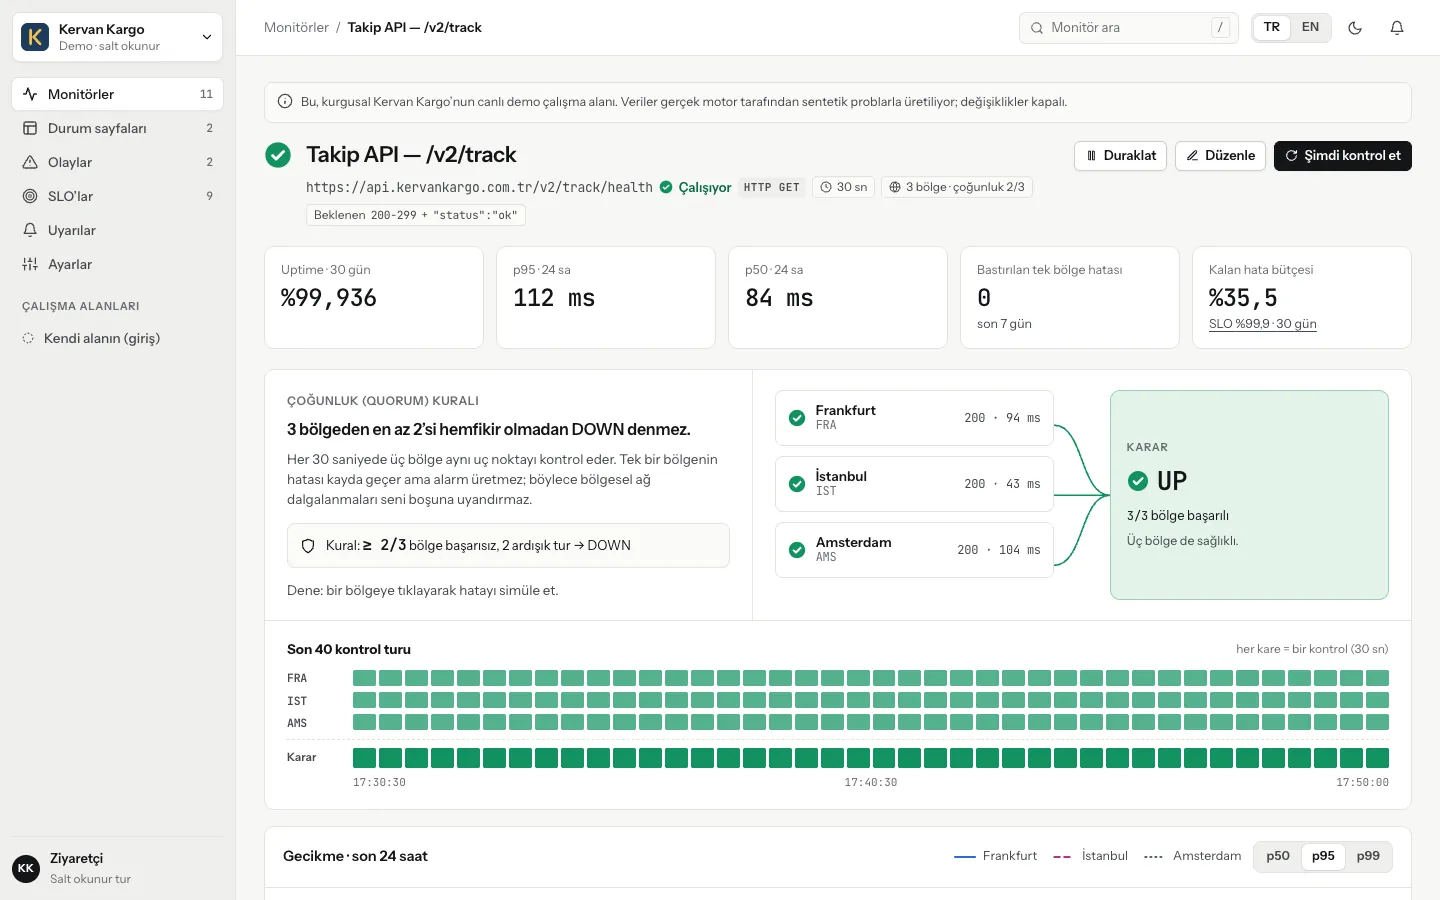
Quorum on one screen: three regions, one verdict, the last 40 rounds. 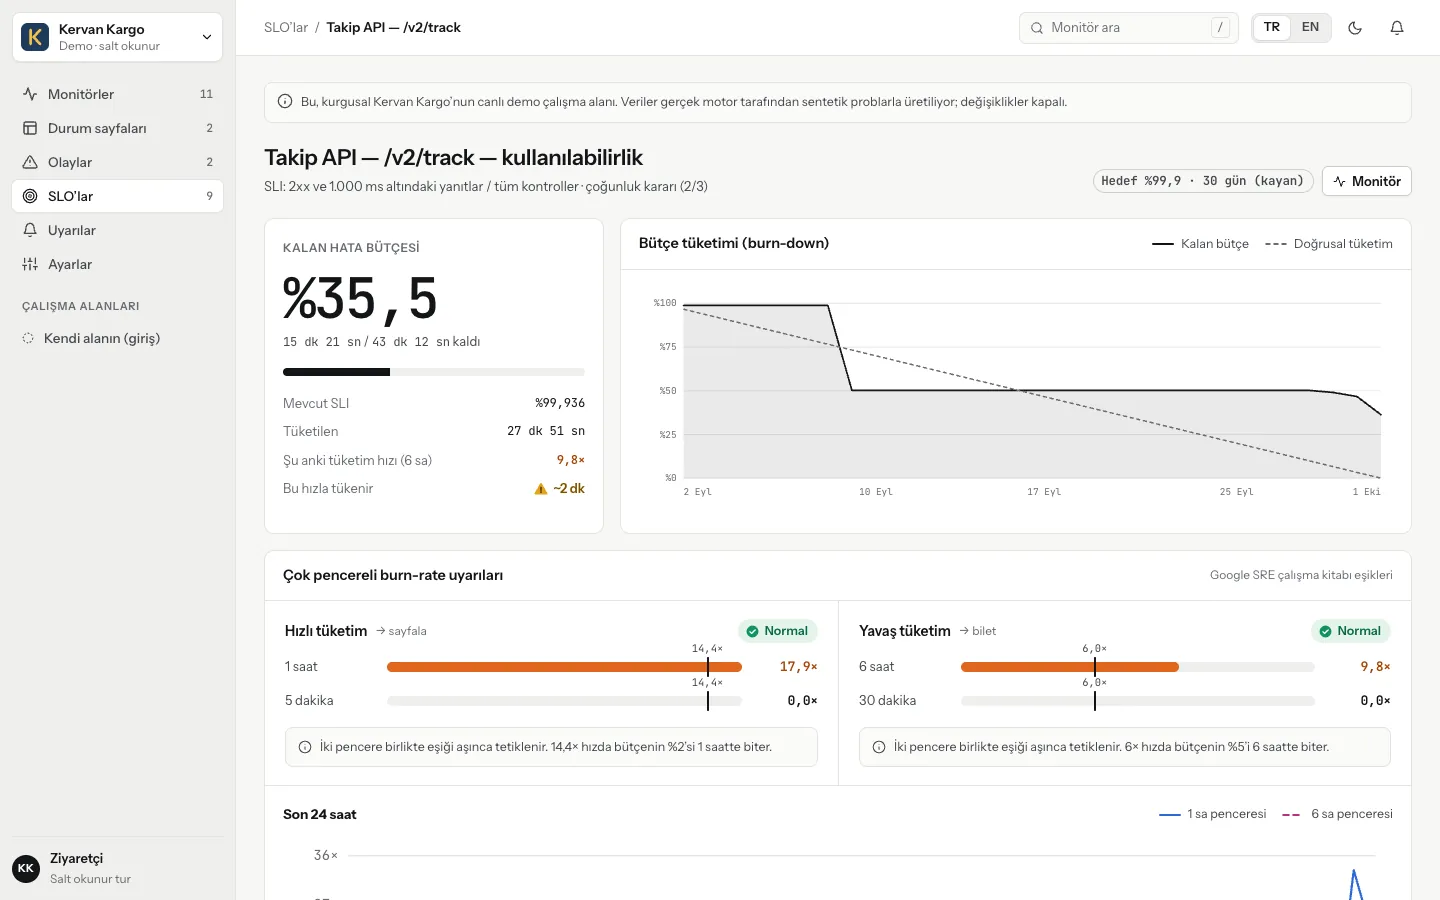
Error budget and multi-window burn-rate alerts, on the Google SRE workbook thresholds. 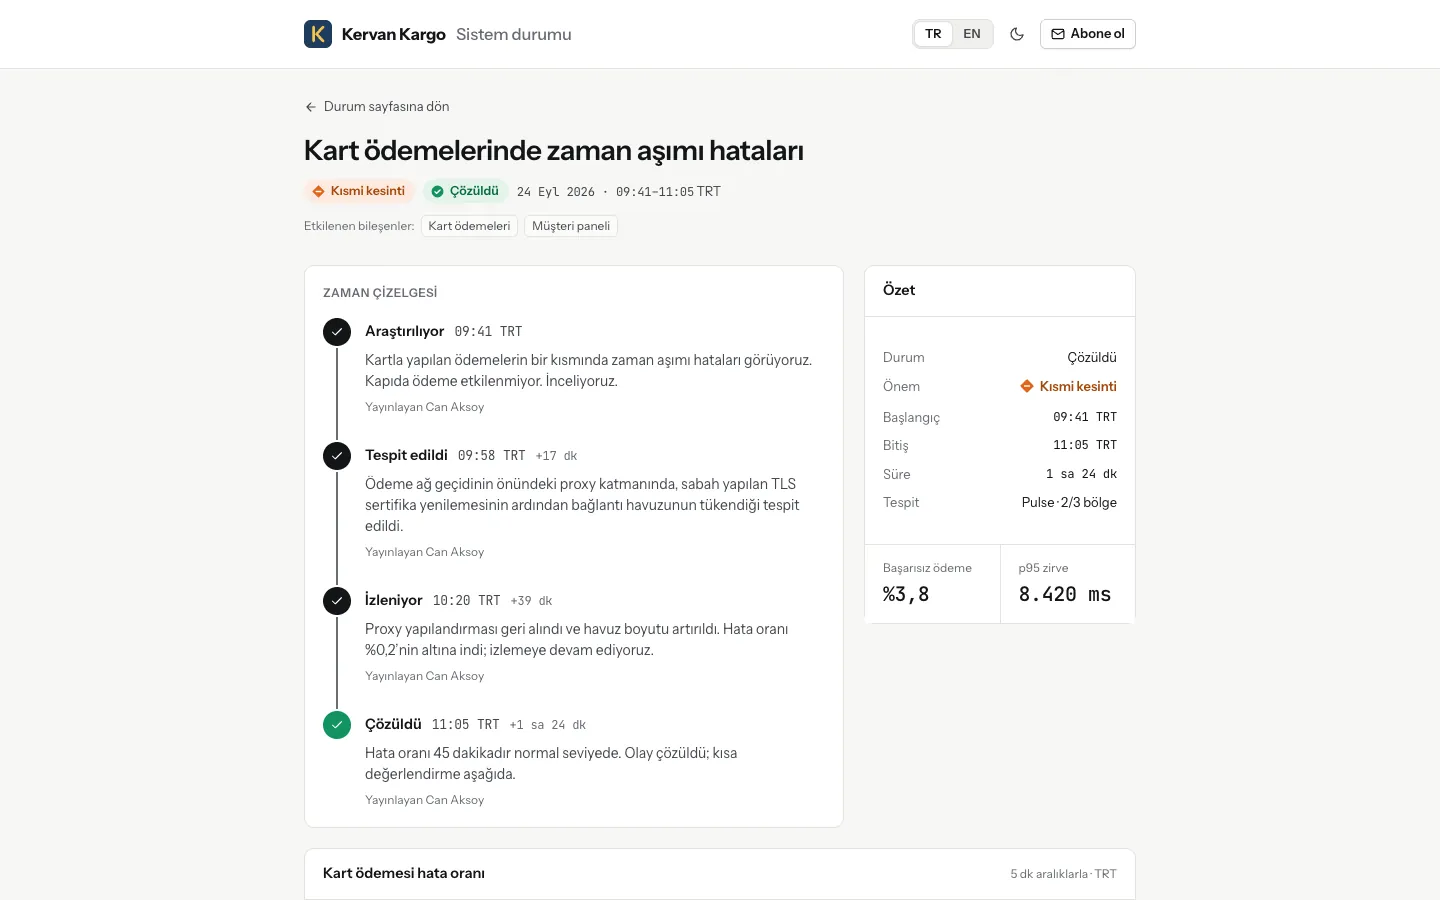
An incident’s public timeline, from investigating to resolved. 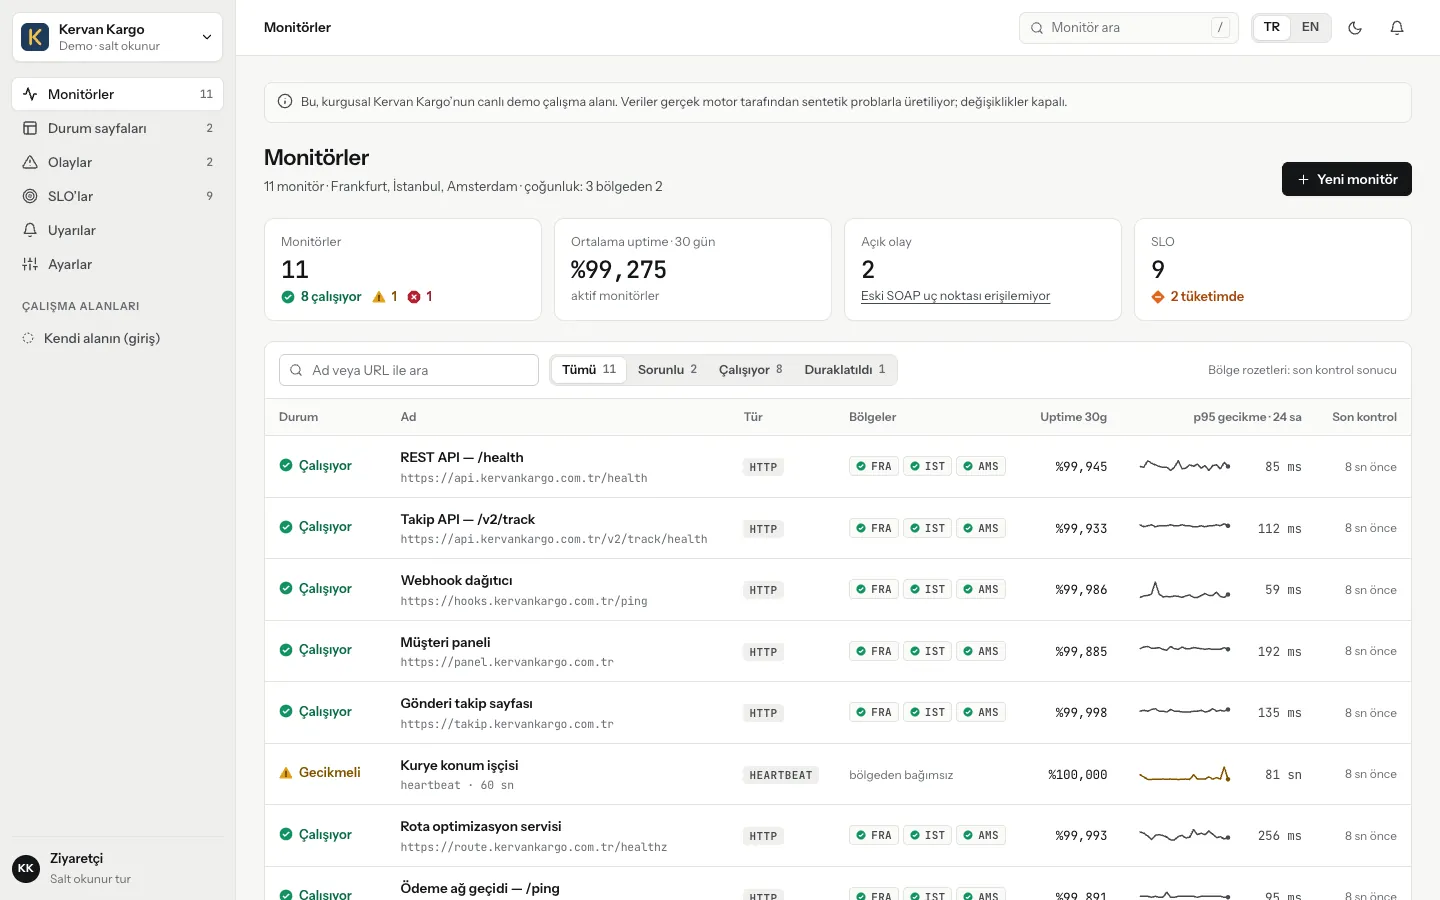
The read-only demo dashboard — open it without signing up. 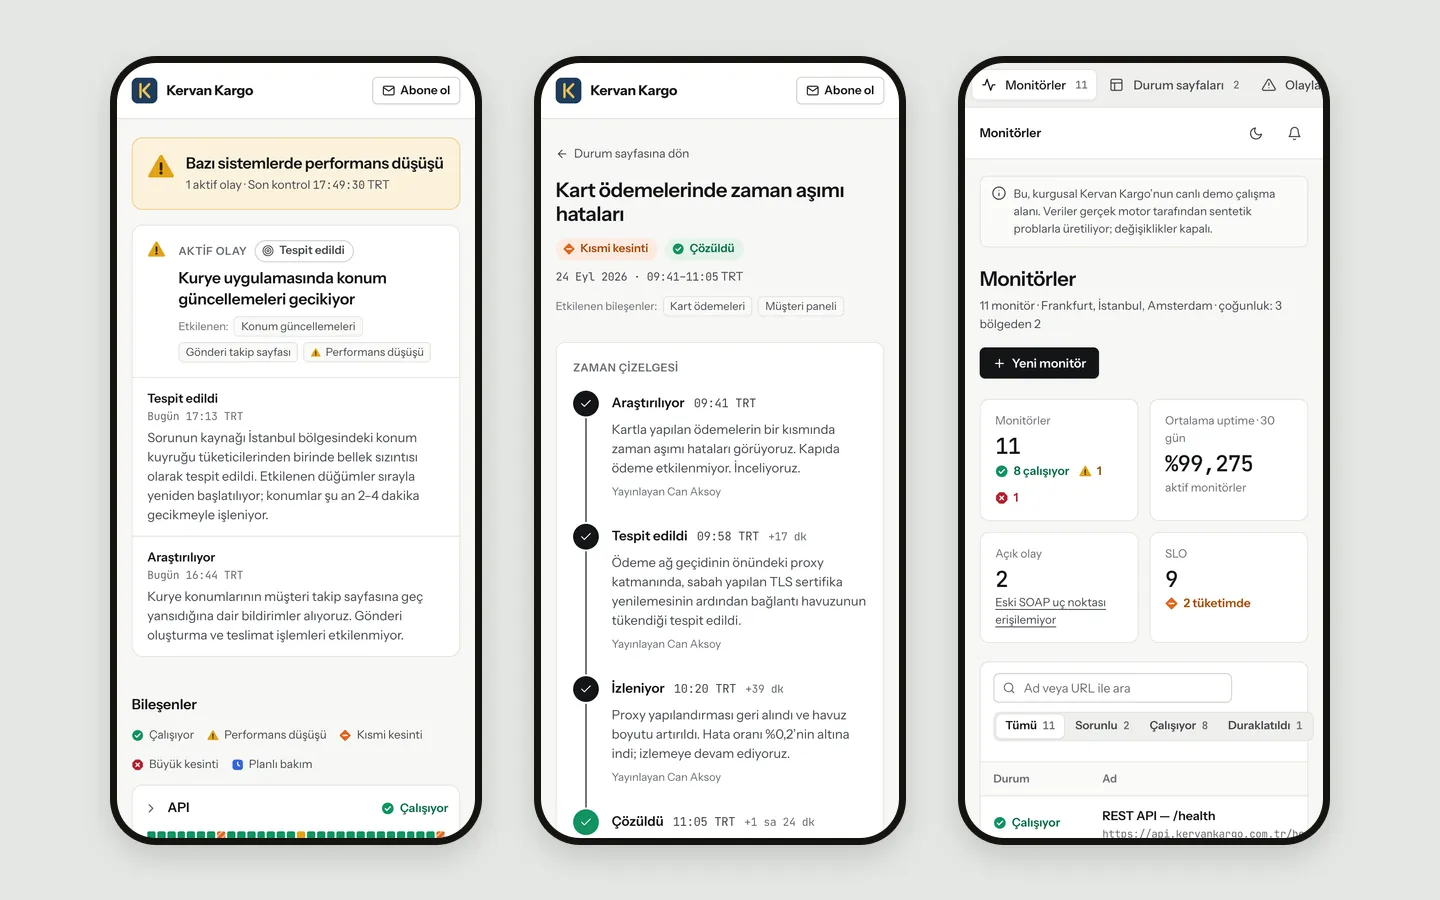
On a phone: status page, incident, dashboard.
Want the longer version — the code, the pipeline, the trade-offs?
Email me